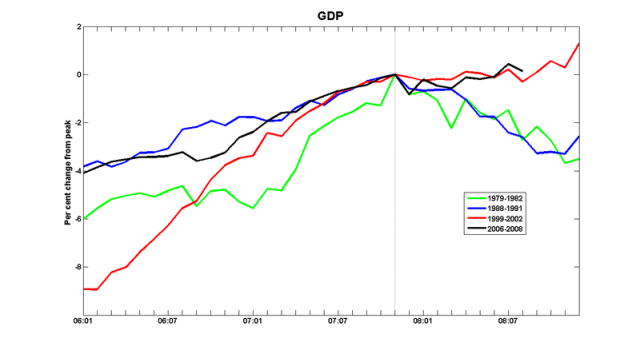
The August 2008 GDP numbers are out, and real output continued its path sideways. As in these posts, all variables in the graphs that follow are logged and re-scaled to zero at the peaks of the
expansions: 1981:04, 1990:03, 2000:12 and (provisionally) 2007:11. They are then
multiplied by 100,
so that they can be interpreted as the per cent deviation from their
values at the peak.
Here is employment:
And here is StatCan's composite leading indicator:

Up until now, we've been following the path set out in 2001-2002: a brief pause between strong expansions. But it's hard to see how this will happen again: what saved us in 2002 was the beginning of the oil boom. Nor does it look as though there will be an imminent US expansion to pull us up out of recession.
Since November of 2007, we've neither fallen into recession, nor have we managed to keep expanding. It's a good thing we don't have the equivalent of the NBER recession dating panel; they'd have a hard time calling a business cycle peak on the basis of these data.
So let's call it a business cycle mesa.

Mesa? Mesa?
How gauche. How American.
Why not use the word “plateau”?
/tongue-in-cheek ends
Phew. For a second there, I thought you were going to make a Jar-Jar Binks joke…