Today's CPI release has core inflation up 1.9% over last January. This is 45 bps higher than December's y/y numbers, renewing speculation that the Bank of Canada may increase interest rates sooner rather than later. But it's important to remember that there's nothing particularly special about the y/y numbers; we could write headlines for core inflation over the past 18 months or the past 6 months (both numbers are 1.8% at annual rates).
This is especially important to remember today. Twelve months ago, we were in free fall, pulling frantically at the rip cord and hoping to the heavens that the parachute would deploy properly. January 2009's core CPI fell by almost 3% at annual rates, establishing a low base for calculating January 2010 y/y inflation rates.
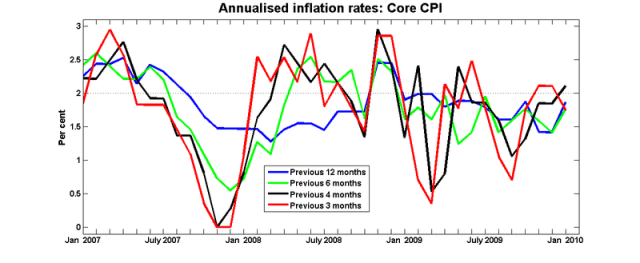
Here is the latest in my series of graphs of core inflation using different horizons:
The one-month increase in core CPI was about 2%, which is consistent with what we've been seeing over the past four or five months.
We will almost certainly see a decline in the y/y inflation rate next month. Even if February's inflation rate stays around 2% at annual rates, simply moving the base away from January 2009 will bring the y/y inflation rate back down to 1.7%.

Actually in times like these, I prefer looking at the levels (and not just for the CPI) rather than growth data. Base effects always screw things up when volatility is high.