The Teranet-National Bank Housing Price Index has begun to make regular appearances in the media ([1], [2]), which is all to the good. But it's important to note – as the producers of the index take great care to emphasise – that the Composite-6 index masks considerable variation in movements in house prices across major Canadian cities.
So here is a graph of the various city-specific indices (along with the Composite-6), expressed as a per cent deviation from their most recent peaks: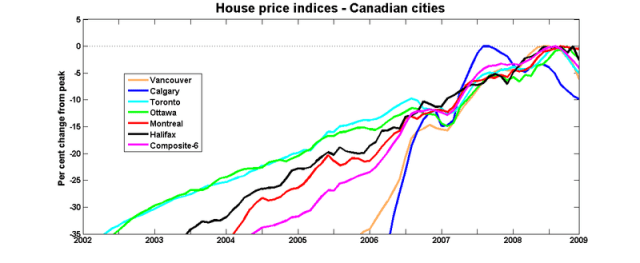
The run-up in house prices in Vancouver and Calgary was much steeper than elsewhere: a drop of 20% would only bring prices back to their 2006 levels. And in places like Toronto and Ottawa, a return to 2006 means a decrease on the order of 10%.

I was just about to post about this – now there is no need, especially since your graph is prettier than mine.
Stephen, Brendon: did either of you read the methodology pdf on the Teranet site? I skimmed it. It looked to me like they have done some very serious econometrics, but it’s over my head.
It’s strange how Calgary peaked so early, well before oil prices peaked.
It’s an important point, but it took many tries before I could figure out a halfway-decent way of putting it in a graph. I’m still not completely happy with it, so maybe you can come up with something better. I’m starting to wonder if one of the more important skills I’ve learned during blogging is how to graph data.
And I wonder to what extent these geographical variations affect our points of view. Out here in Quebec, we look around and see that things are pretty much under control. But I can understand that people working out of Vancouver would be considerably less sanguine.
Stephen, what charting software do you use?
Matlab. It’s what I use for my numerical/econometrics work, and so far it’s been able to do pretty much everything I want.
“considerably less sanguine” is an understatement! Vancouver was already in a bubble in 2005, so given the runup after that, we’re off the charts, and this wasn’t an English or Australian style runup in prices with no increase in supply, so there’s lots of places built that will have to find occupants, plus a huge component of local employment is (was) residential construction, plus migration to the city has been low by the standards of the last few decades. Add in completion of all the pre-Olympic projects and things don’t look good.
The one plus is that an aging population should work in Vancouver’s favour, unless outmigration of local boomers outweighs inmigration of boomers from colder climes.
Cool chart btw,
I haven’t yet had the time to read the methodology, but I plan to. I’ve been doing some (paid) work on the Alberta economy recently and it really is incredible how bad the housing sector is there right now and how quickly it turned.
I don’t have a comment on the topic. I visit just for self educational purposes. I agree the graph is pretty.
On that topic, I find Grapher is a very good program for technical graphing.
I’d like to see a few more cities in that index. Winnipeg, Edmonton, Saskatoon, Kelowna, Kitchener-Waterloo, St. Catherines-Niagara Falls and and Quebec City come to mind. (Then again, all kinds of things come to mind at two in the morning – mostly not the kind of things that belong in indexes.)
Raging: the Teranet methodology relies on “matched pairs”: a given house that has sold twice in recent years. If you look at their sample sizes, for a smaller city like Halifax for example, it seems they don’t get too many matched pairs. So I think that’s why they can’t do the smaller cities. Sample size too small.
Yep. In Halifax, they only get about 200 matched pairs in the peak of the summer selling season, and it drops way down to around 50 in the winter. Given all the other very careful things they do with the data, I bet they get a bit low on degrees of freedom in Halifax in winter.
Bankruptcy stats are looking ugly, especially for AB:
http://strategis.ic.gc.ca/eic/site/bsf-osb.nsf/eng/br02112.html
http://www.bankruptcycanada.com/bankstats1.htm
I think AB is in for a really hard time. My observation is that people here spent like drunken sailors believing the boom was going to last forever. Increasing unemployment will make for lots of foreclosures and defaults.
“My observation is that people here spent like drunken sailors believing the boom was going to last forever.”
I have this vision of guys kneeling at the bumpers of their F350s, scraping off the “Please God let there be another boom, I promise I won’t piss it away like last time” bumper stickers.
I’m partial to Minitab. It has a scatterplot with perturbations for categorical variables to help see frequencies. I haven’t seen that anywhere else, though you could easily right a wrapper for the Matlab plotter to accomplish the same thing. It also plays nice with databases, which I like.