This is an update to my series of posts (2009Q1, 2009Q2) that uses Statistics Canada's estimates for monthly GDP estimates (available for the first two months of the previous quarter) and the LFS data for the last month of the quarter to provide an estimate for GDP growth in the previous quarter. Statistics Canada will be releasing their numbers towards the end of the month.
It doesn't seem very likely that we'll be seeing the sort of happy news for 2009Q3 GDP growth that we saw in the US:
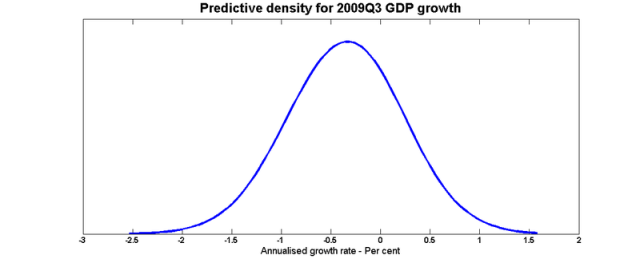
The mean of this distribution is -0.35%, its standard deviation is 0.5%, and the interquartile range is [-0.7 , 0.0].

very interesting – especially since everyone, including the Bank of Canada, got all excited about the third quarter a few months ago and started revising their forecasts up substantially. My own model has Q3 at about 2% but I have a hard time believing it. It would be a real shock to financial markets if Q3 was negative.
Just out of curiosity, based on that distribution what is the probability that we’ll see some growth? Looks like about 35% – 40% but it’s hard to tell.
Adam: Doesn’t “The mean of this distribution is -0.35%, its standard deviation is 0.5%, and the interquartile range is [-0.7 , 0.0].” mean that the probability is 25%? Or am I muddled about what “interquartile” means?
He gives the figure right there: interquartile range goes up to 0.0, so 25% of the dist is > 0.0
Or you can use 1 – std. norm. cum. dist (0.35/0.5) and get 0.242 (this shouldn’t be trusted too much as he only gives 1-2 sig figs
Stephen, at some point can you present the improvement you see to predictions from adding in the final month’s LFS numbers? In other words, could you get predictions which were substantially as accurate just by using the first 2 months’ GDP figures, or does the LFS really add info?
Stephen, do you include US GDP data in the model. US and Canadian GDP is surely cointegrated, no?
MattM: The correlations between employment, hours worked and monthly GDP aren’t zero, so there is some contribution.
Adam P: This isn’t a time series forecasting model; It’s what people who do current analysis call a “backcast”. I suppose I could add non-Canadian data from September to get better fix on Canadian September GDP – but what, though?
Yes, I understand. Bringing up cointegration was a mistake, you essentially have a filtering problem here.
My point was that, suppose you start with the displayed distribution as your prior and I come along and tell you that US Q3 GDP growth was 3.5% annualized. Is your posterior different from your prior?
The statement “US and Canadian GDP is surely cointegrated” should be changed to something like, surely your liklihood is not flat with respect to US data (though it may reasonably be flat if LFS data completely reflects the US data, but I’d imagine there’s enough noise around that both are informative).
Also, to answer the “but what, though?” question, I would say anything that you think is informative. The cointegration comment was basically my way of saying that surely US data is informative here.
Hmm. This would involve setting up a two-country model, so that US news can be used to update Canadian forecasts.
I won’t be doing that for the blog versions, but I’m starting a real-time forecasting project, and we’ll see.
“MattM: The correlations between employment, hours worked and monthly GDP aren’t zero, so there is some contribution.”
Yes, but the real question is whether or not the LFS provides significantly more info on monthly GDP than do GDP numbers from the previous two months….
http://en.wikipedia.org/wiki/Likelihood-ratio_test
I’m using all three sources: July and August GDP and September LFS.
And I use Bayesian methods, so I’m not going to do a LR test!
Stephen,
Off topic, but I thought you might find this interesting re the evolving role of bloggers:
http://www.nakedcapitalism.com/2009/11/curious-meeting-at-treasury-department.html
We at Seeking Alpha think your blog is great and would love to have you join our team. Please contact me at contributors@seekingalpha.com.
Thanks,
Becci
About Us
Seeking Alpha (www.seekingalpha.com) is the premier financial website for actionable stock market opinion and analysis. Handpicked from the world’s top blogs, money managers, financial experts and investment newsletters, Seeking Alpha publishes more than 250 articles daily. Seeking Alpha gives a voice to over 2500 contributors, providing access to the nation’s most savvy and inquisitive investors. The award-winning site is the only free, online source for over 3,000 companies’ quarterly earnings call transcripts including all of the Russell 3000 Index. Seeking Alpha has 40 million page views each month and combined with their distribution partners (Yahoo Finance, Google Finance, Reuters, Bnet, Etrade and others) has a total reach of 50 million unique monthly readers. Seeking Alpha was named the Most Informative Website by Kiplinger’s Magazine and received Forbes Magazine’s ‘Best of the Web’ Award.
Stephen, why is this Gaussian? A Gaussian distro comes from a large number of uncorrelated events. But as (I think) Brad DeLong pointed out, in a crisis all correlations are 1. Surely the odds of something awful happening (even though the world banking situation is better than it was) are a lot larger than indicated by a purely Gaussian tail.
-CJ
That is fine curve you have their. Is it a natural distribution? just asking