Thanks to my daughter, and to commenters, I have now learned "Paint", and can now post a simple diagrammatic exposition of macroeconomics with monopolistically competitive firms. This may be useful in its own right, and can help readers understand the point I was making in my previous post.
The first diagram should be familiar to anyone who has taken first year micro. It shows the demand (d), marginal revenue (mr), and marginal cost (mc) curves of a monopolistically competitive firm in profit-maximising equilibrium. I left out the average total cost curve because: my daughter didn't teach me how to draw curves; it doesn't play any role in the analysis anyway.
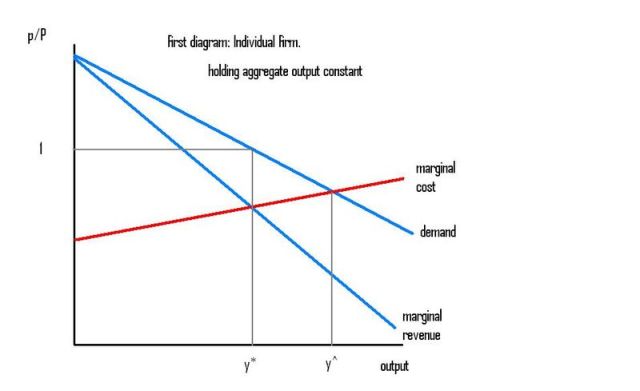 The firm's profit-maximising ouput is y*. I'm not sure why I bothered to also include y^, which shows the level of output this firm would choose if it acted like a perfectly-competitive firm, and set output where price=marginal cost.
The only thing that would look a little weird to a microeconomist is the vertical axis. The vertical axis measures the firm's relative price p/P, which is the individual firm's price p divided by the average price level P. And I have depicted an equilibrium in which the firm chooses to set a relative price of 1, so that p=P.
The equilibrium relative price is 1 because I am doing macroeconomics, and it's much easier to do macroeconomics if we can use representative firm analysis, so I am looking for a symmetric Nash equilibrium, where all firms set the same price and same output.
[I once proved, to my satisfaction, that in the limit, as the number of firms gets large (which makes sense in macro) the Cournot-Nash equilibrium (where firms set output) is the same as the Bertrand-Nash equilibrium (where firms set prices).]
There is a large number of firms in the macroeconomy (we never need talk about "industry", which lets us avoid all the silly disputes about how to define "industry" when firms sell differentiated products). Each firm's product is different from any other firm's product (which is why each firm faces a downward-sloping demand curve), but firms are symmetrical. All the differences are the same, as it were. So we can still analyse the economy in terms of the representative firm. That keeps it simple.
Each firm faces an inverse demand function p/P=D(y,Y), where p and y represent that firm's price and output, and P and Y represent the average price and output of all the firms. Each firm will also face a (real) marginal revenue function MR(y,Y) and (real) marginal cost function MC(y,Y) defined over the same two variables, y and Y. In a symmetric Nash equilibrium, each firm will choose to set p=P and y=Y.
The first diagram (above) shows what I call the micro demand, marginal revenue, and marginal cost curves. They are defined as D(y,Y*), MR(y,Y*), MC(y,Y*), and are drawn holding all other firms' output constant at the equilibrium level Y*. The first diagram's curves (labelled in lower case d, mr, mc) show what happens if an individual firm deviates from the symmetric Nash equilibrium, and shows it won't want to.
The second diagram (below) shows what i call the macro demand, marginal revenue, and marginal cost curves. They are defined as D(Y,Y), MR(Y,Y), MC(Y,Y), and show what happens to the representative firm's relative price, marginal revenue, and marginal cost, when all firms expand output together. (No, I am not talking about collusion; I am sticking to Nash equilibrium, but I need to find out where that Nash equilibrium is, and if it is unique, and stable. And that requires imagining what would happen if all firms did expand output together, and then asking whether an individual firm would subsequently want to reduce its output again.)
This second diagram may give more trouble.
The macro demand curve D(Y,Y) must be horizontal at 1. If all firms have the same output, they must have the same price, so the relative price is 1.
The macro marginal revenue curve MR(Y,Y) will be horizontal at (1-1/E), [edited to fix mistake spotted by himaginary] if the elasticity of demand (E) is constant. If firms' demand curves become more elastic in a boom it will slope up (as drawn); and if they become less elastic in a boom it will slope down. (No, it is not a mistake to draw this macro MR curve below the horizontal macro demand curve, though that would of course be a mistake for the micro curves). The macro MR curve will be flatter (or more upward-sloping) than the micro mr curve, because an increase in other firms' outputs will shift the micro demand and mr curves to the right. (That's a source of strategic complementarity, or positive feedback.)
The macro marginal cost curve MC(Y,Y) will generally be steeper (or more upward-sloping) than the micro marginal cost curve, because an increase in other firms' outputs would generally tend to increase real wages and shift the micro mc curve upwards. (That's a source of negative feedback.)
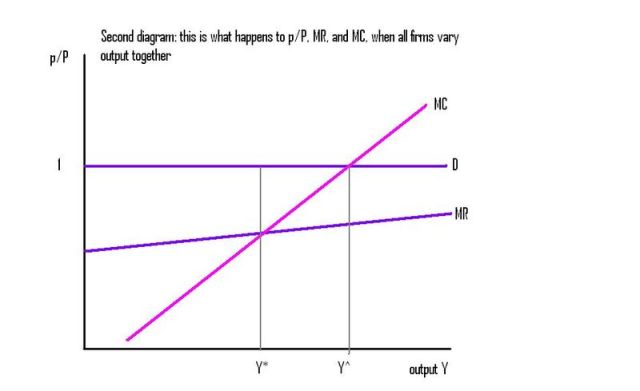 The intersection of macro MR and MC curves in the second diagram (above) determines the symmetric Nash equilibrium level of output Y*. If the macro MC curve cuts the macro MR curve from below, Y* will be a stable equilibrium (if all firms increased output above Y*, each firm would find MR<MC, and would want to raise its relative price and cut its output). Otherwise (if positive feedback is greater than one) the equilibrium will be unstable. If the macro MR and MC curves intersect more than once, there will be multiple macro equilibria, even if the micro equilibrium in figure one is stable.
The intersection of the macro MC and Demand curves show what the macroeconomic equilibrium would be if firms acted like perfectly competitive firms and set output where MC=P. They would all set output at Y^.
The third diagram (below) shows the macroeconomic equilibrium again, but now with the nominal price level P on the vertical axis, rather than the real (relative) price that firms set. Except for the second Long Run Aggregate Supply curve, LRAS(2), it will be familiar to macroeconomists.
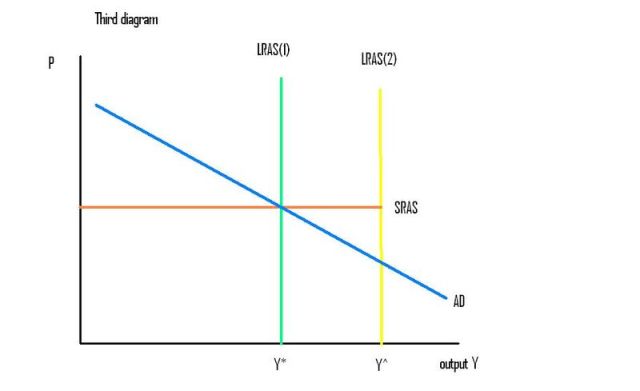 The Aggregate Demand curve AD comes from outside the model. It shows points in {P,Y} space at which the excess demand for goods in terms of money is zero. You can use MV=PY, or the AD curve derived from ISLM, or whatever you feel like.
If prices are perfectly flexible, the economy will be on the leftward LRAS(1) curve, at Y*. Provided prices are flexible, and that equilibrium is unique and stable, money will be as neutral with monopolistic competition as with perfect competition. Shifts in the Aggregate Demand curve AD will have no real effects in the long run.
But in the short run, if prices are fixed, we get the horizontal SRAS curve. An increase in AD (a rightward shift in the curve) will cause real output to increase in the short run. But notice how the SRAS curve stops dead when it hits LRAS(2), at Y^. That was the main point of my previous post. If prices are fixed, and AD shifts right, monopolistically competitive firms will expand output past Y*, but only up to Y^. At Y^, which would be the macroeconomic equilibrium if firms were perfectly competitive, firms will have P=MC, and will not choose to expand output any further. They will ration customers if AD expands further.
[If I had drawn all three diagrams perfectly, y*=Y* would be lined up perfectly in all three diagrams, showing the same symmetric Nash equilibrium from all three perspectives. But y^ in the first diagram could be either greater or less than Y^ in the second and third diagrams.]
If you want microfoundations: start with a utility function U(y,Y); differentiate it with respect to its first and second arguments to define a marginal rate of substitution function MRS(y,Y)= U1/U2; recognise that rational consumer choice implies p/P=MRS(y,Y); recognise that MRS(y,Y) must therefore be the same function as D(y,Y). Just make sure that D(y,Y) is symmetric, so that D(x,x)=1 for all x. Then differentiate (real) total revenue y(p/P)= yD(y,Y) with respect to y to get MR(y,Y). Or, since a Marginal Rate of Substitution function is equally as primitive as a Utility functions, just start with any MRS/Demand function D(y,Y), in which D1 <0 and D2 >0 and D(x,x)=1 for all x.
To get the MC(y,Y) function: add labour L to the utility function, differentiate it with respect to L and Y to define the MRS(L,Y) function between L and Y, which equals the real wage W/P. So W/P=MRS(L,Y). Add a production function Y=F(L), or y=F(l), to define the marginal cost function MC(y,Y)=(W/P)/F'(l)=MRS(F-1(Y),Y)/F'(F-1(y)).

you’ve completely lost me.
Anyways, use Paint.net instead of Paint — it’s free, almost as simple, and easier to use if you want to get beyond straight lines.
Question, how do firms distinguish when they are planning for SRAS or LRAS? How do they know that SRAS has met LRAS? maybe this will clarify it for us.
ari: sorry I lost you. Thanks for the advice on Paint.net, but I really need to take a breather and recover my equilibrium, after learning Paint. I’m a technophobe.
Rogue:
If every firm has y=Y* (they are on LRAS(1)), each firm has MR=MC. No firm wants to rise its relative price (cut output), and no firm wants to lower its relative price (raise output). In other words, each firm is on exactly the profit-maximising point on its demand curve.
Now suppose we hold each firm’s price fixed, and shift the AD curve right just a small amount, so Y>Y* but Y less than Y^. We are to the right of LRAS(1), but to the left of LRAS(2). Each firm increases output to meet demand, because MC is less than P, so it gains profit on each additional unit of output. It would like to raise price, to increase profit further, but can’t by assumption, because prices are sticky.
Now increase AD even more, holding prices fixed, so that Y=Y^. We are now on LRAS(2).
If every individual firm has output y=Y^, each will find that its marginal cost will equal price, so any additional output past that point would mean MC would rise above P, so it would lose money by satisfying demand past Y^, even if there were willing buyers at the existing price.
WARNING: Don’t use the “less than” symbol in comments, because Typpad interprets it as some html thingy.
Any chance you can apply this post to this Krugman post?
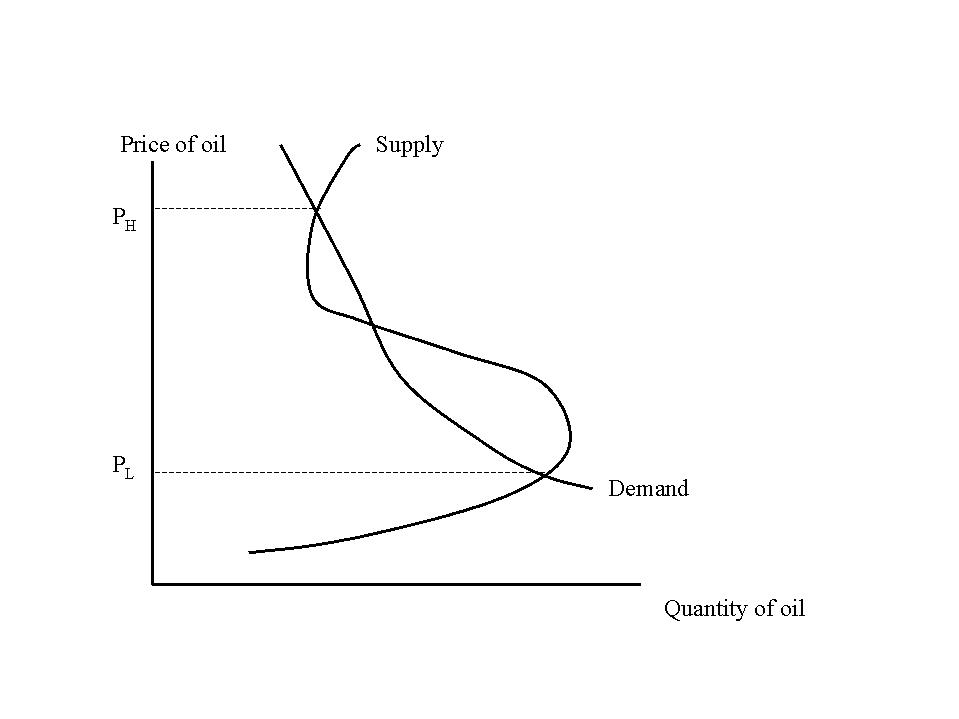
http://web.mit.edu/krugman/www/opec.html
This picture from that link has a Price (low), a Price (eq) [not shown], and a Price (high).
Nick’s post said: “Now suppose we hold each firm’s price fixed, and shift the AD curve right just a small amount, so Y>Y* but Y less than Y^. We are to the right of LRAS(1), but to the left of LRAS(2).”
I think we are back to the question of does the fed attempt to control AD thru currency denominated debt thru the interest rate(s).
And if so, why is there so much demand for currency denominated debt?
I have one small request. Can you make the letters/numbers bigger? I can hardly see them. Other than that, the graphs are fine. Thanks!
OK! I managed to figure out how to make the letters bigger, so you can read them! I’m feeling very proud of myself!
Too much Fed: that Paul Krugman post shows a market for oil with multiple equilibria. If I made my macro MR and MC curves curvy in the second diagram, I could get them to cross 3 times, and get multiple equilibria too. Other than that, no relation between this and PK’s post. The determination of AD, and the role of monetary policy in shifting AD, is off-topic for this post.
oo
I assume the line ” Each firm increases output to meet demand, because MC ..”
end like this ” ..is less then the new MR at Y*”
is that right ??
“… no relation between this and PK’s post.”
” The determination of AD, and the role of monetary policy in shifting AD,
is off-topic for this post”
what ???
both assertions may be wrong sir
i think you have a pure well exchange model here
and this model as a panglossian figment
only a eco 101 prof could love
is absolutely nothing but “itself”
its a mirror reflecting a mirror
and a pure to the plus perfect tense
monetary only macro model
with short run quantity adjustments (ie cornot) and some mysterious bertrand moments in the interstices between every now period and the pro temp ever after period …
proof by seduction is it not ???
the seduction of twinkling fairy dust
we are no longer in kansas we are in …edgeworthistan
and
in for a bout of pure exchange
dollars say for drams of soma
called elixir(n) perhaps
where n equals the number of wells in the system
might one suggest it’s a one good system
this elixir (n)
varies only in strength
but it varies in m strenghts where m is as high as n
or total m so high and randomly scattered among the n
what is the diffrence
a huge set of naturally producing wells perhaps seems neat
imagine if there were only a few !!
each one of the n wells is independently owned and operated
where the marginal good (additional high at point of consumption )
from every purchased dram from any well
ends up equalized “ordinally mates ordinally ”
ie
each wankercustomer consumer gets an unknowable incomprarable high
but whatever amount it is
every one wants as high a high as she can purchase
in each wanker craving mind
the last “lift “of the last dram equals the price of the last dram bought
bought ???
what if each wanker has a a well of their own…??
a big enough well
then we got no exchange
so we must have a mix of dirth and surplus
but then in a one good system why trade anyway??
well intertemporal considerations
recall we have limitless product differentiation
in this case by strength
ie
high for high the well drams exchange in proportion of strength
so once u’ve consumed all your well can produce
do you need more
yes especially if your well-less
consider this even if there is no
“satiety”
an expected own well ouput might vary badly over time
in good years well owners sell a surplus and get ….. dollars
legal tender for elixir
from wankers who “have dollars ” and a craving beyond their wells capacity
say they are somehow well-less but “holdin'” as we say
maybe they sold their well–a lemon– for dollars last exchange day
oh no now we got a market for wells yikes
pass by rapidly
maybe we have a public good too
see foot races
with dollar rewards somehow mapped on to time and finishing position
hey maybe ala 13th century florence its an every one thing
all are contestents in a series of foot races
each wanker assigned by lottery to one or another foot race
off topic ??
if st nick’s model is a fragment of reality made animate and whole
like a talking foot
that frag here is a system of n interlaced balance sheets and various periodic entries
dollarized outcomes
of submerged heterogenious production systems ??
i think not
there appears at best one real factor imput labor smuggled across the border between rowe land
and the ricardo empire
no real intermediate products no multi period means of production
can all that complication be nicely swept away
–talking foot —
at any rate looking at this purely balance sheet world
you assume a stock of assets and maybe god save austria liabilities at the firm level
only these balance sheets are also reified as …elixir wells
u can’t even address the issue of response to the new money shock you suggest
without some original sin here
some primordial cain and abel essau and jacob friggler wiggler
to get well inequality let alone well-less -ness
btw i think if dervived from ISLM u can’t have a liquidity trap
fine for eras where nominal rates remain high enough under all shocks to adjust
enough to reach LRAS(2)
utlity fiddling
pure relabeling eye wash
since all is money exchanged for money inside the system
your utlity frigger is merely translating dollars into benthamite coins
if not that then errr elixir high
ie rendering it in essence barter …gad zooks
not providing motivation
since ad always equals some translation of tu
paine: “I assume the line ” Each firm increases output to meet demand, because MC ..”
end like this ” ..is less then the new MR at Y*” is that right ??”
Ooops! That “less than” symbol caught me twice! I have now fixed my comment above.
It’s not a pure exchange economy, since my firms are producing output.
If each consumer only wanted to consume one variety of the good, then it would indeed make sense for each consumer to buy the firm producing his most preferred variety. In which case there would be no exchange at all. Each worker/owner/consumer (or group of worker/owner/consumers) would just consume their own output. But it is easy to escape that “no trade” solution. Just assume that each person likes to consume all varieties, in equal proportions. And that each worker needs to specialise in producing just one variety. That seems roughly realistic. Each of us consumes a wide variety of goods, but only produces one or two different goods.
Not sure if that answered all your points.
Nick,
I’m starting to worry about you. I can’t understand your columns. I don’t know if they’re too wonkish for me, or I’m being played. But in today’s environment I’m always going to opt for the latter explanation: I’m being played.
Here’s why.
It’s my contention that in any research tradition presuppositions are used to explain phenomenon and at the same time the explained phenomenon is used to validate that traditions presuppositions.
Now that macroeconomics faces real problems over its presuppositions macro-economist are reverting back to mathematical models. Is this an attempt to regain prestige by mystifying–when it comes to math I mystify easily–and avoid macroeconomics’ problems?
Nick, is there anyway of saying in three short paragraphs without the use of any economic jargon or math what you are getting at here?
Once a tradition has been debunked–can’t account for abnormalities–that research tradition needs to change or fuse with others. It just can’t say oops and go on like nothing happened. This hasn’t happened in the neo-classical tradition.
I fear I’m being played; that rather than change macro-economists are turning into Gnostics where the highest knowledge is only understood by the initiates.
I detect a trend of mystification in macroeconomics as a way to regain prestige without having to change its presuppositions. Use math to shock and awe the layman into accepting the same old tradition with its same old presuppositions.
Beware Nick, this can’t work in a world where the scariest two words for us layman are “economist say.”
This change hasn’t happened
nick
i think you might need to examine what happens when you add
“Just assume that each person likes to consume all varieties, in equal proportions”:
this punch is in fact a single complex composite good
the fixed proportions assumption
as to it being a model of production and heterogenious product exchange
i say no
it’s not production as it stands now
its more like pow care packages
to say something is produced turns out to be
a ricardian corn model at best
hey this gets briary ultra fast
so don’t try operating out in the real world
with this glass box of a model
that was my only serious point
once you realize its artificial fixities
wjd123: you are not being played. This post is very wonkish (compared to my others). The reader who might benefit from it most is someone who has already seen (much more complex) mathematical models of macro with monopolistic competition, but who had never seen a (simpler) graphical representation. But I was hoping too that people who were familiar with micro models of monopolistic competition, but unfamiliar with macro models, might catch the intuition of macro models of monopolistic competition. But if you are totally unfamiliar with my first diagram, you are unlikely understand the rest of the post.
I first started thinking about macro models of monopolistic comp in about 1985. At that time, all macro models were based on perfect comp. And yet, when I walked around in the real world, monopolistic comp seemed to fit my experience much better than perfect comp. (Each firm did differ in some ways from every other firm; if a firm raised its price a little it didn’t lose all its customers, etc.). So I wanted to see what macro would look like if firms were monopolistic rather than perfectly comp. When I figured it out, it made my mental model better fit the facts of my experience at the macro level too (e.g. starting in LR equilibrium, an increase in AD really did increase output, and really did seem to make people better off; and no, those predictions do NOT come out of a macro model with perfect comp.)
And yes, I really did need the math, and the diagrams, and the abstract modeling to really get my head around what was going on, so I really did understand properly what happens to macro when you assume monopolistic rather than perfect competition. Until then, I was just BSing myself.
So, for me, this whole exercise really was an attempt to get my mental model of the macroeconomy to better fit the facts of my experience. (It’s better, but still a long way from perfect.) It’s not just a math snow-job. (Actually, any competent Economics PhD student could cream me at maths! This post is piddling stuff by current standards.)
There is only one empirical prediction I talk about in this post: the fact that the SRAS curve does not stop dead when it hits LRAS(1), but continues rightward till it hits LRAS(2). That is a very important empirical prediction, and it’s what this post is about. I ignored all the other empirical reasons we might have for wanting to do macro with monopolistic rather than perfect competition.
paine: No. You would only get a composite good if all varieties had to be consumed in fixed proportions (L-shaped indifference curves). I’m not assuming fixed proportions; if I were the individual firms would face a vertical demand curve, and the macro MR curve would be negative, so there would be no positive equilibrium. I’m assuming that the consumer would want equal proportions if all varieties had the same price, but would substitute away from one variety towards others if the relative prices changed away from one. Standard curved indifference curves, but symmetric about the 45 degree line, so I can use representative firm analysis.
Nick,
Thanks for taking the time to try to explain to me what you are doing and why you are doing it. I understand the why. I’ll work on the what.
i clearly mis read you
so in the long run the proportions change thru relative price adjustments
that register as shortages and over stocks like in a linear program
there are slack variables
however the pricing decision is not likely to be free slack is it
with any storage capacity
indeed your interpretation of the model
its not a one composite good
but is it now consistent with your model
much as the indeterminate output of the perfect comp firm is arbitrarily solved by budget constraints
u’ll need more then the present mr mc curves to fix firm out put
eh ??if prices are fixed
in fact can the consumers have heterogenious preferences for combos ???
lets consider the classic pow care package exchange model
where trading occurs between the pows perhaps organized around cigarette prices
there the total quantities of each good are fixed in each period
its at bottom a rations system
in the ever after perhaps we can allow adjustments
starting next shipment even
if prison letters filter back fast enough
maybe with the trade ratios recorded in cigarette prices
the red cross now might see the difference between ratios in the camp economy
and actual prices in the home country and adjust quantities accordingly
but this is not monopolistic competition
since each candy bar is alike in each care package each can of tuna etc etc each pack of smokes
ie commodification is complete ie the product space is antithetical to the stigliz dixit product space
again
as a philosphy of economics question
is your model telling us anything we can use to further understand the real world ??
what here is much different from simply having fixed prices and short run budget constraints on the firms
the slack issue in the macro sense of slack is triggered by a shock
(itself artificial eh ?) not any conceivable endogenious development
in this period model really a dynamic input output model if its to become
a production plus exchange model
not just an exchange of mana
each time you ad another layer of mediation theorems disappear
exchange alone production added then using lancaster not stiglitz adding product features and maybe household production ala becker
intuitions based on this model will be as off as those based on arrow debreu
are u at least seeing my drift here ??
i don’t think you have a model of a monopolistic economy
but rather at best of a monopolistic sector of an economy
ie not a closed macro system at all
i know you like splitting hairs so did i as a callow fiend
so take your rather keen passage
” The Aggregate Demand curve AD comes from outside the model. It shows points in {P,Y} space at which the excess demand for goods in terms of money is zero.”
ie combos of prices quantities and household budgets coincide with existing real money balances all is in nashville but even if it isn’t the prices won’t respond now
there will just be slack
precisely the outcome you use to blow up your model in your note
its a knifes edge for sure i suspect
therefore clearly rabbit hole time
” You can use MV=PY, or the AD curve derived from ISLM…”
okay
“or whatever you feel like.”
yikes mabe true but think about that for a second
these models all give me the chills as models
why not just use dynamic systems with feed backs
then the model can remain unspecified
yes it reduces practical macro economics to a clinical science
so what
that worked well enough for medicine when doctors dared review outcomes
and gave up open feed back practices like blood letting motivated by airy revealed truth dogma
the earth resting on a turtle
is no more silly then these logical toy macro systems
the turtle here ??
prolly the clearest is you ad curve
but
as you suggest with its derivation
you can take your pick of turtles
i like the wells like
” producing firms”
of graph one
ultimately as model builders not policy wonks
we need to build price quantity algorithms that plausibly simulate what we see out there
without the dandy keynesian short cuts
that this crisis has partly proven
are perfectly useable by macronautical engineers
albeit now only to stablize us into a stagnation
ie contain depression
but optimate global market dynamics
ie cross border trade and credit flows
thru stagnatory discretionary policies
the ben and larry yellow flag caper uber alles
Thanks Nick, this is just what I needed to see.
“The macro marginal revenue curve MR(Y,Y) will be horizontal at 1/(1-1/E)”
Isn’t it “1*(1-1/E)” ?
I see your point (main article) applied to a large and relatively closed economy, such as the USA. But in the case of a small open economy, with a fixed exchange rate, wouldn’t it be different, with the non-tradeable sector working under monopolistic competition, but the tradeable sector working closer to perfect competition (with consequences for the macro equilibrium)? And in this case, if, for instance, the real exchange rate becomes (and remains) overvalued, couldn’t the situation resemble the Cuban economy problem (in terms of “national” aggregates), with persistent excess demand (cleared, in this case, through the accumulation of external deficits and debt)?
vb
“see your point (… applied to a large and relatively closed economy, such as the USA..”
you are wildly reifying
it can’t be applied to anything
only extended corrected loved and admired
for its lovely maybe even counter intuitive
and down right spooky
rabbit hole outcomes
…..like most euclidian exercises
himaginary: “”The macro marginal revenue curve MR(Y,Y) will be horizontal at 1/(1-1/E)” Isn’t it “1*(1-1/E)” ?”
Oooops! Yes. Well-spotted! Mistake fixed.
Will respond to other comments later.
paine: I tried to follow you, but you lost me. Sorry.
Doc: Thanks! I take it that means it makes sense to you?
VB: Turning this into an open economy might make a difference: if the export sector is perfectly competitive; or if foreign demand for varieties is either more or less elastic than domestic demand; if foreigners demand different varieties than do domestic residents; etc. Any change in the composition of aggregate demand (between foreign and domestic) would then change relative prices, and/or shift the macro MR curve up or down.
In general, if part of the economy were perfectly competitive (whether or not it’s the tradeables sector), then starting in long run equilibrium, an increase in AD, with prices fixed, would indeed cause excess demand and rationing in the perfectly competitive sector.
Thanks.
“The macro marginal revenue curve MR(Y,Y) will be horizontal at (1-1/E), [edited to fix mistake spotted by himaginary]”
And, “himaginary: “”The macro marginal revenue curve MR(Y,Y) will be horizontal at 1/(1-1/E)” Isn’t it “1*(1-1/E)” ?”
Oooops! Yes. Well-spotted! Mistake fixed.”
Is the edit wrong?
Never mind assuming “1*” means 1 times.