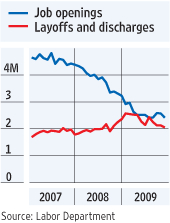
Here is a graph – stolen from the Wall Street Journal – for which I very much wish I were able to make a Canadian version:
These numbers come from the BLS Job Openings and Labor Turnover Survey; there is no Canadian counterpart to this data source.
When Statistics Canada releases its monthly Labour Force Survey, it publishes numbers for the stock of people who are employed and unemployed in a given month. This is of course a very important piece of information to have, but our understanding of the state of the labour market would be even better if we had data on the flows into and out of employment.
For example, we know that in December 2008, there were 1.210m people who were unemployed, and in December 2009, there were 1.568m – and increase of 358,000 in the stock. But are we talking about the same people? We're pretty sure that there are not upwards of a million people out there who are perpetually unemployed. In a given month, some people who are employed lose jobs and some people who are employed find jobs: the difference between these numbers shows up as the change in the number of people who are unemployed.
We don't have much in the way of data on how many Canadians are moving in and out of unemployment: all we have is the stock. There are data on EI beneficiaries, but that's not the same. For example, we don't how many people drop off the EI rolls because they found a job, or because they exhausted their benefits.
These numbers are important. If there's a lot of "churn" in the labour market – that is, if people cycle in and out of unemployment fairly quickly, then the focus of policy should be to provide short-term financial support to the unemployed. But if the transition rates out of unemployment are low, more emphasis has to be put on training and skills development.
US data (as in the WSJ graph above) suggest that recessions are characterised not so much by an increase in the rate of job loses, but as a reduction in the rate of job creation. This may also be the case for Canada – but I don't know that for sure.
Statistics Canada used to collect data on gross flows into and out of employment (see this post), but they don't anymore. When I asked, I was informed that there were problems with the survey, and that they had stopped collecting those numbers. And they have plans to start doing so again.
I wish they would revisit that decision.

“US data (as in the WSJ graph above) suggest that recessions are characterised not so much by an increase in the rate of job loses, but as a reduction in the rate of job creation. ”
This in particular happens every time that a new price floor is put on wages. Unemployment rises, but mostly because people hold off on hiring. Anyway, we need better models of the unemployment aspect of recessions.
I might suggest we need better models on hiring trends and employment prospects. The challenge of looking into a rear view mirror to to keep focused on where you are headed.
theinsurancestandard.blogspot.com